
This article explains how to use Summary-type Results Dashboards to display data from multiple assessments on a single dashboard, including creating the dashboard, setting assessment filters on merge strings, and building cross-assessment views.
On this page
- What is a Summary-Type Results Dashboard?
- When to Use This Dashboard Type
- Step 1: Create the Summary Dashboard
- Step 2: Add Content and Set Assessment Filters
- Example A: Response Status Overview Across Assessments
- Example B: Individual Respondent Results for a Single Assessment
- FAQs & Troubleshooting
What is a Summary-Type Results Dashboard?
Results Dashboards in Brilliant Assessments come in four types: Individual, Cohort, Assessment, and Summary. Each type determines what level of data the dashboard displays. For a full overview of all dashboard types and how to build them, see Building and Deploying Results Dashboards.
The Summary type is the most flexible. Unlike the other three types, a Summary dashboard is not tied to any specific assessment, cohort, or individual. Instead, you control what data appears by setting Assessment, Cohort, or Response filters directly on each merge string within the dashboard.
This means a single Summary dashboard can display data from multiple different assessments side by side - each tile can pull from a different assessment.
When to Use This Dashboard Type
A Summary-type dashboard is the right choice when you need flexibility across assessments. Common use cases include:
- Response status overview across assessments - See completion rates for multiple assessments in one view. Especially useful for assessors who need to quickly see which responses are ready to be assessed across all their assessments.
- Quick view of all respondent results - Display individual scores for all participants of an assessment without needing to create a cohort or group them formally. Useful when you just want a snapshot of how everyone scored.
- Multi-assessment executive dashboard - Combine key metrics from several assessments on one page for a management overview.
- Assessor workflow dashboard - If you use the Assessor functionality, a Summary dashboard lets assessors see at a glance which responses across any assessment are in "Ready to Assess" status.
Step 1: Create the Summary Dashboard
- Go to Assessment Manager > Results in the left menu.
- Click Add Dashboard.
- Enter a Name and Title.
- Under Type, select Summary.
- Click Save.
Note: Unlike Assessment, Cohort, or Individual types, no additional dropdown appears when you select Summary. This is because Summary dashboards are not linked to a specific assessment - you define the data source per merge string using filters (covered in the next step).
Step 2: Add Content and Set Assessment Filters
This is the workflow that is unique to Summary dashboards. Every merge string in a Summary dashboard should have an Assessment, Cohort, or Response filter set so the system knows which data to display. Follow these steps carefully:
- Add a container and tile to your dashboard as normal.
- Type or paste your merge string into the tile content area. For example:
{BarMulti[SplitType=R Label=Y]} - Click Save on the tile.
- Re-open the tile for editing.
- Highlight/select the merge string text.
- The filter panel will appear on the right side of the editor, showing:
- Assessment - select which assessment this merge string should pull data from.
- Cohort - optionally narrow to a specific cohort.
- Response - optionally narrow to a specific response.
- Select the desired Assessment from the dropdown (e.g., "DISC").
- The system will automatically insert the assessment's numeric ID into the merge string (e.g.,
AssessmentNo=1234). - Click Save again.
Important:
- Every merge string in a Summary dashboard must have an Assessment (or Cohort or Response) filter set. Without it, the system does not know which data to display.
- You must save first, then re-edit and highlight the merge string to see the filter panel. It will not appear on first entry.
- Different tiles within the same dashboard can reference different assessments. This is the power of Summary type - Tile 1 might show Leadership data (
AssessmentNo=1234), while Tile 2 shows DISC data (AssessmentNo=4321).
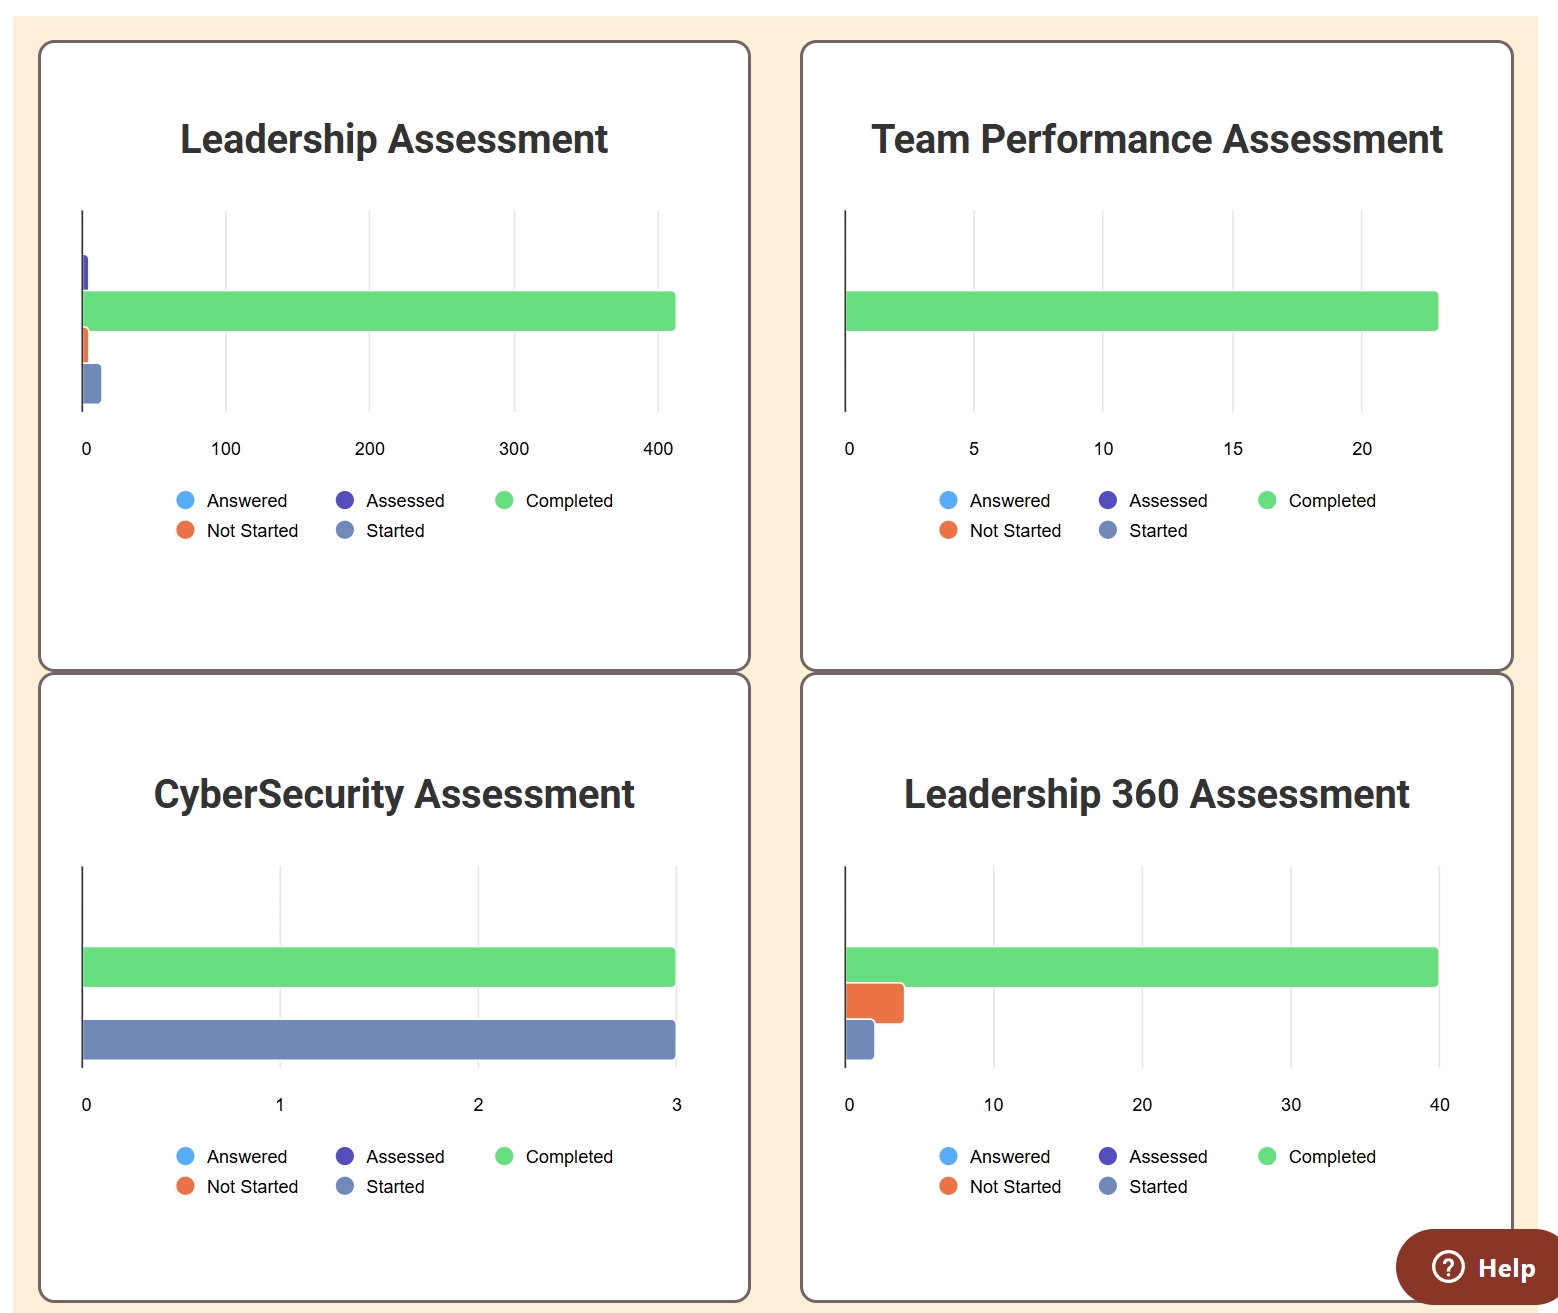
Example A: Response Status Overview Across Assessments
This example shows a Summary dashboard with four tiles, each displaying the response status for a different assessment: Leadership, Team Performance, CyberSecurity, and Leadership 360. Each tile uses a horizontal stacked bar chart with response status colors (Completed, Started, Not Started, Assessed).
Each tile has a different AssessmentNo= in its merge string, so each pulls data from a different assessment.
Merge string used:
{BarMultiHorizontal[ResponseStatus=All BarSize=25 Metric=Count AssessmentNo=1234]}
| Parameter | What It Does |
ResponseStatus=All |
Shows all status types (Completed, Started, Not Started, Assessed) |
BarSize=25 |
Controls the bar thickness (25 pixels) |
Metric=Count |
Shows actual count of responses rather than percentages |
AssessmentNo=1234 |
Links this chart to a specific assessment (set via the filter dropdown) |
Use Case: Assessor Workflow
This layout is especially useful for assessors. If your platform uses the Assessor functionality, assessors can see at a glance which assessments have responses in "Assessed" or ready-to-assess status, without navigating into each assessment individually.
 Example B: Individual Respondent Results for a Single Assessment
This example shows all individual respondents' scores for the DISC assessment, displayed as a bar chart where each bar is a different respondent. This is useful when you want to quickly compare all participants' results without creating a cohort or formal grouping.
Merge string used:
{BarMulti[SplitType=R Label=Y AssessmentNo=4321]}
| Parameter | What It Does |
SplitType=R |
Splits the chart by individual response (each respondent gets their own bar) |
Label=Y |
Displays the score label on each bar |
AssessmentNo=4321 |
Links this chart to the DISC assessment |
FAQs & Troubleshooting
Use the questions below to troubleshoot common issues with Summary-type Results Dashboards.
If you have any questions, please get in touch with our Customer Success Team: Support@brilliantassessments.com
Comments
0 comments
Please sign in to leave a comment.